
Both Nifty 50 and Bank Nifty have had a bearish week and we expect this trend to continue over the coming week.
It seems like we have entered a medium-term bear market and markets have started correcting, this was long due and is healthy for a longer term bull market.
The 16,700 level on the Nifty 50 is very crucial and should the index break this support zone, a significant correction in price can be expected.
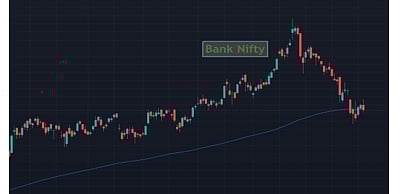
Bank Nifty has an important support zone near the 35,300 levels which if broken will result in further correction.
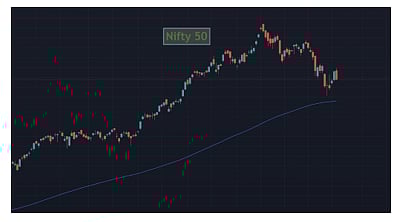
Nifty 50 |

Bank Nifty |
Bank Nifty |
Nifty FMCG
The FMCG index has seen significant correction from its all-time high and is looking rather weak.
We would advise investors to stay away from equities in general over the coming few weeks.
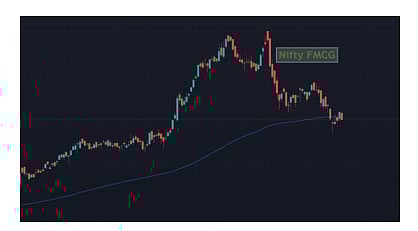
Nifty FMCG |
Nifty IT
The IT sector looks like it has finally begun to consolidate. This was much needed, the quality of companies in this sector will make it hard for a very large correction in terms of price, however, we could see a timewise correction over the coming weeks.
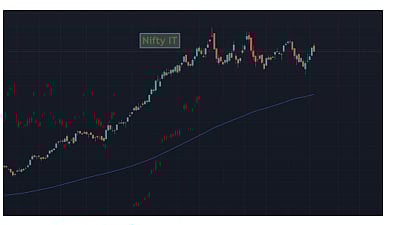
Nifty IT |
Derivative Outlook
Nifty current month future closed with a premium of ~56 points to its spot. Next month's future is trading at a premium of around ~114 points.
We saw open interest reduction of nearly 2.67 percent in Nifty.
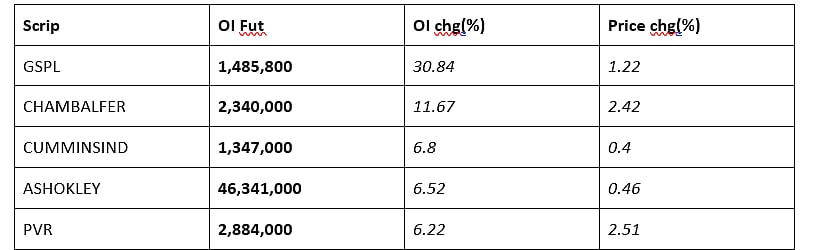
Long Formation |
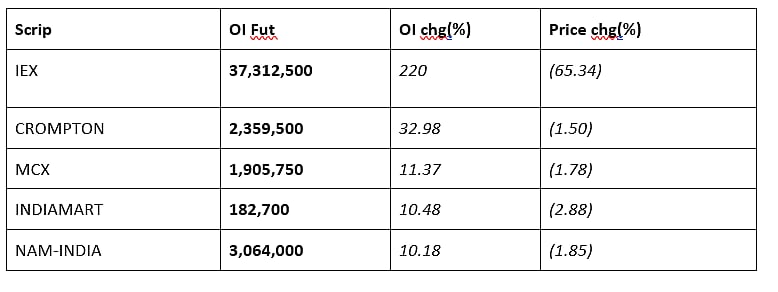
Short Formation |
Top 5 recommendations of the week
M&M
M&M is trading at the resistance of the previous support level. It has formed double top pattern formation on the daily timeframe which indicates bearishness. After breakdown, it has pulled back and formed a bearish candle which indicates a good shorting opportunity.
Short M&M below 822 CMP 836.95
Target 1 - 805
Target 2 - 789
Target 3 - 772
Stop loss: 855
HAVELLS
HAVELLS has formed Cup & Handle pattern formation on daily charts which indicates again the bullish trend may continue. Any sustainable breakout above 1425 level will have a good buying opportunity.
Buy HAVELLS above 1425 CMP 1383.25
Target 1 - 1476
Target 2 - 1527
Target 3 - 1578
Stop loss: 1323
HINDUNILVR
HINDUNILVR has taken resistance near its 30 day moving average which signals bearishness. It is already trading in the downtrend for the past three months which creates a bearish view on the stock. Below 2335 level good opportunity for shorting.
Short HINDUNILVR below 2335 CMP 2343.65
Target 1 - 2311
Target 2 - 2287
Target 3 - 2263
Stop loss: 2383
SHREECEM
SHREECEM is trading at the resistance level of the previous support zone on the daily chart. It has formed lower low lower high pattern formation on the daily chart which confirms bearishness. Below 25160 level good opportunity for shorting.
Short SHREECEM below 25160 CMP 25914.05
Target 1 - 24365
Target 2 - 23570
Target 3 – 22775
Stop loss: 26750
AMBUJACEM
After a strong uptrend, AMBUJACEM had formed a triple top pattern on the daily chart indicating trend reversal in the stock. After breakdown it had taken a pullback and formed a bearish candle which is the perfect entry point for shorting.
Short AMBUJACEM below 365 CMP 376.60
Target 1 – 352
Target 2 - 339
Target 3 - 326
Stop loss: 386
(Gaurav Udani is the founder and CEO, ThincRedBlu Securities- a technology-driven retail broking firm. He tweets @Udanii. Views are personal)