
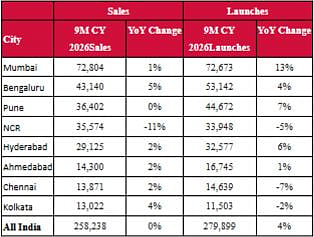
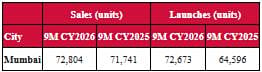
Mumbai: Knight Frank India, the leading international property consultancy, in its latest assessment of the Indian residential market, reported that Mumbai's(Mumbai Metropolitan Region) residential market recorded 72,804 housing sales during January to September 2026 (9M CY2026), up 1% year-on-year (YoY), the highest nine-month sales volume since 2018. Developers launched 72,673 units, up 13% YoY, keeping new supply closely broadly aligned with sales. While homes priced below INR 1 crore (cr) continued to account for the majority of transactions, sales in this segment softened, with growth increasingly led by homes priced above INR 1cr. Mumbai remained India's largest residential market, accounting for 28% of the total 2,58,238 home units sold, and 26% of the overall new supply of 2,79,899 home units across leading eight cities in the country.
Residential sales across the eight key markets held steady at 258,238 units in 9M CY2026, broadly in line with the same period last year, underscoring the sustained appetite for homeownership despite evolving market dynamics. A total of 279,899 units were launched during 9M CY2026registering a growth of 4%. In Q3 2026, launches stood at 92,549 units, representing 4% higher YoY. This suggests that developers are increasingly aligning supply with sales, even as inventory continues to build gradually. The volume of units launched continued to exceed sales in Q3 2026, marking the 16th consecutive quarter of this trend.
Market Summary: Top Eight Indian Cities
Source: Knight Frank Research
Mumbai Residential Market Summary – 9M CY2026
Source: Knight Frank Research
Sales increased sequentially through the year, rising from 23,185 units in Q1 to 24,170 units in Q2 and 25,449 units in Q3. The Q3 2026 sales were the highest quarterly level since 2018 and marginally exceeded Q4 2025 units, making it the city's highest quarterly sales since 2018.
Developers launched 25,491 units in Q1, 23,670 units in Q2 and 23,512 units in Q3. With nine-month launches broadly in line with equal to sales, unsold inventory declined 2% YoY to around 155,473 units.
Demand broadens across price points
Affordable Segment Softens but Retains Majority Volume
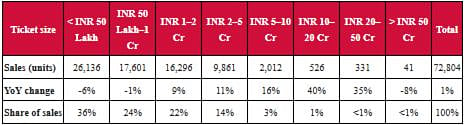
Homes priced below INR 50 lakh remained the largest individual segment, accounting for 36% of Mumbai’s total sales, with 26,136 units sold during 9M CY2026. However, this segment witnessed a 6% YoY decline, compared to the same period last year. Mumbai accounted for 55% of all homes sold in this segment across the eight cities.
Similarly, the INR 50 lakhs to INR 1 crore price categoryrecorded sales of 17,601 units, dipping by 1% YoY, yet holding a substantial 24% market share. Combined, affordable housing still commands majority of Mumbai’s total sales volume, though its growth momentum is slowing down.
Ticket-Size Split of Sales – 9M CY2026
Source: Knight Frank Research. Shares may not add to 100% due to rounding
INR 1 cr to 5 cr ticket segment Drives Growth
The strongest growth came from the INR 1 crore to INR 5 crore segments, which together accounted for 36% of total sales.
INR 1 Crore to 2 Crore: Sales in this segment rose 9% YoY to 16,296 units, accounting for 22% of total sales.
INR 2 Crore to 5 Crore: Sales in this segment recorded 9,861 units, up 11% YoY and accounting for 14% of the market share.
The most explosive growth percentages during 9M CY2026 were documented in the elite ticket sizes, demonstrating the ultimate resilience of Mumbai’s high-net-worth individual (HNWI) buyer base.
Higher-ticket segments also recorded strong growth. Sales of homes priced between INR 5 cr and INR 10 cr increased 16% YoY to 2,012 units. Transactions in the INR 10 cr to INR 20 cr segment rose 40% to 526 units, while sales in the INR 20 cr to INR 50 cr segment increased 35% to 331 units.
Mumbai also accounted for 41 of the 53 homes priced above INR 50 crore sold across the eight major cities during the period.
Prices rise broadly in line with inflation
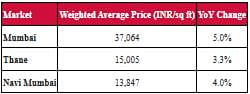
Residential prices across the Mumbai Metropolitan Region recorded steady growth. The weighted average price in Mumbai stood at INR 37,064 per sq ft in Q3 2026, 5.0% YoY, while prices in Thane and Navi Mumbai rose 3.3% and 4.0% to INR 15,005 and INR 13,847 per sq ft. Price growth close to consumer price inflation of 4.8% points to a stable, end-user led market.
Mumbai Residential Price Movement – Q3 2026
Source: Knight Frank Research. Prices are weighted by unsold inventory across active projects launched since 2019
Absorption improves
Quarters to sell (QTS), the time required to absorb unsold inventory at the prevailing pace of sales, improved to 6.4 quarters in Q3 2026 from 6.6 quarters in Q3 2025 and 7.1 quarters in Q1 2025. A lower QTS indicates faster absorption.
Mumbai Quarters to Sell (QTS)

Source: Knight Frank Research. QTS = unsold inventory ÷ trailing eight-quarter average sales pace. A lower QTS indicates faster absorption
Gulam Zia, International Partner, Senior Executive Director, Research, Advisory, Infrastructure and Valuation, Knight Frank India, said, “Mumbai's housing market has maintained sales momentum through 2026, with 9M sales reaching their highest level since 2018 despite a significant increase in new supply. The more important shift is in the composition of demand. Though the city continues to anchor India's affordable housing market, while homes priced above INR 1 crore now account for 40% of sales, supported by rising incomes and the city's expanding base of financial services and corporate employers. Developers have broadly matched supply with absorption, helping inventory and quarters to sell improve. With price growth remaining close to inflation, at around 5%, the market enters the festive season on a healthy footing, continues to show measured expansion, supported by sustained demand for higher-value homes.”
To get details on exclusive and budget-friendly property deals in Mumbai & surrounding regions, do visit: https://budgetproperties.in/