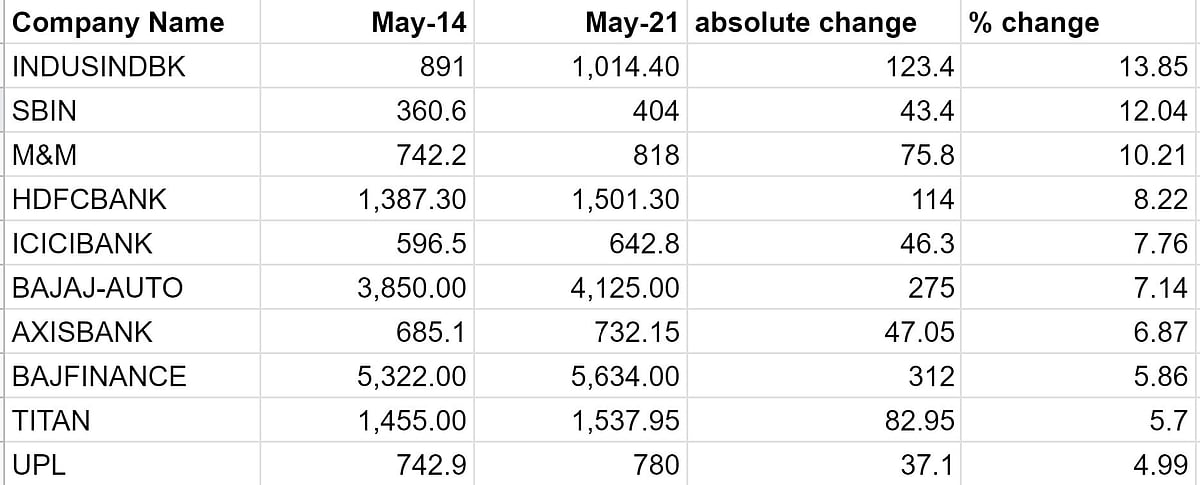
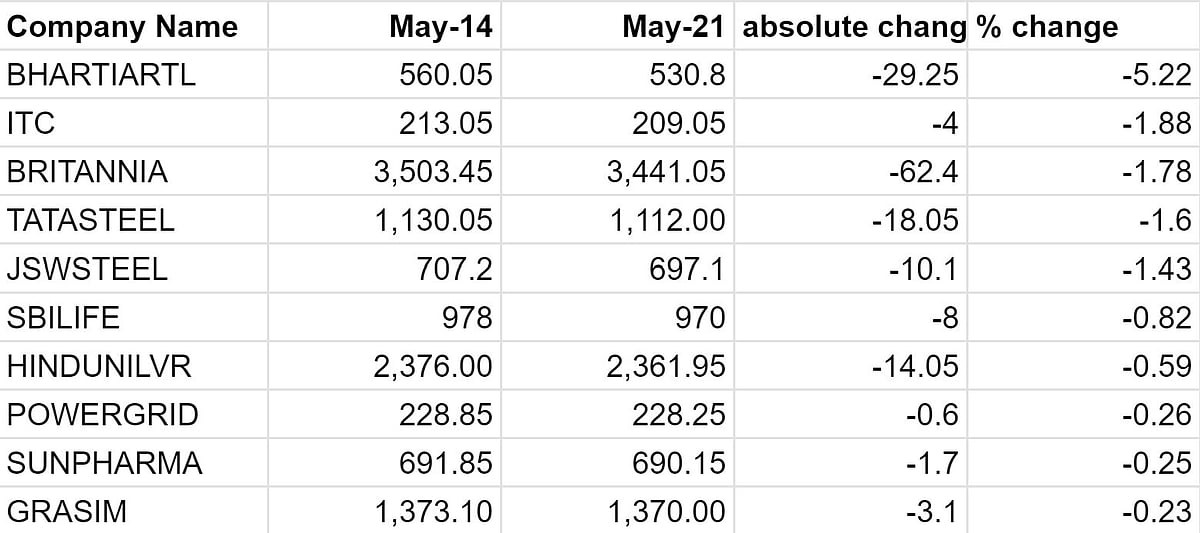
It was an energetic week for the market players as Nifty witnessed strong gains during the week supported by banking, financial and auto stocks. Good Q4 results, falling COVID-19 cases in the country and positive global cues were continuously pushing up the stock prices. Mostly Midcap stocks performed well with the Nifty Midcap index gains of 4.5 percent in a week. Other indices like PSU, AUTO, MEDIA have also contributed gains to keep the nifty index higher.
The benchmark index settled at 15,183.10 levels with a gain of 3.5 percent on a weekly basis, whereas Bank Nifty rose by 7 percent in a week to close at 34606.90 levels. A few stocks like IBULLHSGFIN, INDUSINDBK, SBIN, M&M, ICICIBANK were the top gainers for the week with average gains of 10 percent.
On a technical front, the Nifty index has breached the prior resistance of 15,044 levels and sustained above the Falling Trendline as well as the upper band of Bollinger formation that suggests a bullish strength in the counter. Moreover, in the recent candle it has formed a Bullish Marubozu candlestick pattern, which indicates bullish movement for the near-term. An Oscillator Stochastic and MACD also suggested positive crossover on the daily time-frame. At present, nifty has immediate support at 15,000 levels, whereas 15,450 will act as crucial resistance zone.
Gainers
Following are the stocks that did well this week.

INDUSIND BANK
The stock has taken a support at 913 level which is a 23.6 percent retracement level of its previous up move which shows a northward movement towards its upside level. On a daily chart, the stock has given a breakout of its upper band of Downward Falling Channel formation which indicates a further upside movement in the counter. The stock has been trading with a positive crossover of 21*50 Hourly Moving Average which can be considered as a Bullish Crossover which shows a Bullish movement in the counter. At present level, the stock has good support at 950 levels while resistance comes at 1060 level crossing above it can show 1100-1140 levels.
SBIN
On a weekly chart, the stock has formed open bullish Marabozu candle which is a sign of bull trend. Furthermore, stock has given breakout of 400 level which was its strong resistance which points out buyers are quite active. A momentum indicator RSI and MACD both have shown positive crossover on the daily chart which adds more bullishness to the price. At present level, the stock has good support at 360 levels while resistance comes at 430 level crossing above it can show 460-480 levels.
M&M
On a weekly chart, the stock has given a breakout of its upper band of Falling Wedge formation which is a reversal formation and signifies a bull run in the counter. The stock has formed “Bullish Engulfing Candlestick” which suggests an upside movement in the counter. Furthermore, price has also moved above upper “Bollinger Band” formation; which suggests bullish rally will continue further for near term. At present level, the stock has good support at 760-levels while resistance comes at 840-level crossing above it can show 860-870 levels.
HDFCBANK
On a daily chart, the stock has given a breakout of its “Downward Sloping Trend line” which indicates an upside move in the counter. Furthermore, stock has formed Bullish Marabozu Candle which suggest strength in the counter. Moreover, the stock is trading above 21 as well as 50-daily Exponential Moving Averages which suggest a positive trend of the stock. Additionally, momentum indicator Stochastic (6) has shown a positive crossover, which indicates strength in the counter. At present level,the stock has good support at 1,400 levels while resistance comes at 1,550 level crossing above it can show 1,570-1590 levels.
ICICIBANK
On the daily chart, the stock has been rising continuously from last couple of days. During the week, it has gained more than 7 percent to close at 642.80 levels. Technically, the stock has been trading in Rising Wedge formation with the support of 21-days Moving Averages. Moreover, in the recent trade the stock has formed Bullish Marubozu Candlestick pattern, which suggests bullish strength in the counter. In additions, spurt in Volume has also observed on the Friday trading session, which confirms the buying interest among the trades. An indicator MACD and Stochastic is also a sign of bullish trend for the near term. At present, the stock may find the resistance at 665 levels while support comes at 615 levels.
Losers
The following stock were the losers during this week.

Bharti Airtel
Bharti Airtel has slipped more than 5 percent during the week and settled at around 530.80 levels. On a weekly chart, the stock has retreated from Middle Bnad of Bollinger formation and sustained below 50-DMA. Moreover, the stock also moved below Ichimoku Cloud formation, which suggests bearish move for the upcoming sessions. A momentum indicator RSI (14) & MACD also suggested the negative crossover on the daily chart, which confirms bearish sentiments for the near term. On the downside, the stock is having support at 515 whereas resistance seems to be at 552 levels.
ITC
During the last week, FMCG counter were in action as we saw good upside move in the ITC as well, but in the recent week, some correction has been noticed in the counter and the stock fell almost 1.4 percent from the weekly highs. Technically, the stock is in range bound move and trading below 100 days Moving Averages. Moreover, the stock is also finding resistance at Upper Bollinger Band formation, which acts as immediate hurdle for the counter. At present, the stock is having good support at 199 levels whereas 220 levels would act as resistance for the counter. Either-side movement may decide the market direction.
BRITANNIA
On a weekly chart, stock has faced resistance from 21 WMA and showed correction from there which points out weakness in the counter. On a daily chart, the stock has been trading in range from 3,400-3,550 but it has strong support at 3400 levels sustained above the same can show bounce back movement. Momentum indicator MACD is also showing positive crossover but trading below zero level crossing above the same can show bounce back movement.
AT present, the stock has support at 3,400-level sustained above the same can show 3550-3600 levels.
TATASTEEL
Tata Steel was range bound all throughout the last trading session between 1106 and 1123.5 and closed as a Doji. The stock may consolidate for a while due to profit bookings in the entire metal sector after having a major Bull Trend. The MACD has a crossover towards the south direction which indicates a further weakness and profit booking sessions in the near term. The Momentum Indicator has been fallen from its strength for upside to the level of 12.2 which indicates a weak side for the stock. The stock although trading above the super trend of 14 days a recovery is expected. The stock has a super trend support of 1074 and resistance of 1,196. Overall, we can see upside move for Tata Steel in the upcoming days.
JSWSTEEL
JSW Steel has been showing weakness since last few trading sessions. The stock has closed slight below its 9 days Moving Average which shows weakness in the stock. The Volume charts indicates profit booking sessions for the stock and a fresh buying might take place. The Momentum Indicator has fallen on -31 levels and also the TSI has a negative crossover on the downside which indicates a weak trend for the stock. The stock has a support at 671 and a resistance at 743 levels. Overall a recovery is expected after a dip.
(The writer is Executive Director, Choice Broking)


