It was a volatile week for the market participant as the Nifty index started the week on a positive note and made a new record high at 15,901.60 levels on Tuesday's trading session; after that, the bears came into action, and there was a bloodbath in the market over a week. Finally, the benchmark index settled at 15,724.95 levels with almost half a percent fall on a weekly basis while Bank Nifty has closed at 34,707.75 with a weekly loss of 1 percent.
On a weekly basis, Nifty IT & FMCG indices were the top performer with average gains of 1.5 percent whereas Nifty Metal, Power and PSU indices were the prime loser during the week. Technically, the Nifty index has formed a Hammer candlestick pattern in the recent trade on the daily chart, which indicates a further upward move in the counter. Moreover, the index has also tested good support at its prior level of 15431, which suggests immediate support for the near term.
On an hourly chart, the index has turned upward from the oversold zones, which point out positive moves for the upcoming session. On a weekly basis, the Nifty may move towards the level of 16,000/16,200 levels while immediate support is intact at 15,450 levels.
Top gainers for week ended June 19

HINDUSTAN UNILEVER
Overall, the stock has performed well with a gain of 5 percent during the week. On the daily chart, the stock has formed a long bullish candle with a higher volume, which indicates Accenture buying in the counter. Moreover, the price has sustained above the Upper Bollinger Band formation and 50-DMA, which suggest bullish strength for the near term. In addition, a momentum indicator RSI and MACD witnessed a positive crossover, which pointed out an upward move in the stock.
TATA CONSUMER
On a weekly basis, the stock has gained more than 3 percent to close at 737.90 levels. Overall, the stock has given a Rising Channel breakout and moved above it, which confirms that the bullish trend may continue for the long term. The stock has been trading above Ichimoku Cloud formation for the last many days, which indicates bullish strengths or the long-term prospect. A momentum indicator RSI & MACD is also supportive of the bullish trend. So we are expecting an upside move in the counter towards the level of 770-800 in the upcoming week.
BRITANNIA
On the daily chart, Britannia has confirmed the Double Bottom pattern breakout and sustained above it, which indicates bullish sentiments in the counter. However, on Friday'S session, the stock has retreated almost half a percent and formed a bearish engulfing candlestick pattern, which suggests some correction in the prices for the near term, and it may retest the neckline of the bottom pattern at 3,555 levels. Although, a momentum indicator RSI & MACD are suggesting positive moves. Hence, we are recommending a buy-on dips strategy in Britannia for the upcoming sessions.
INFOSYS
On a weekly chart, the stock has sustained above the prior resistance of 1477 levels and gained more than 4 percent to close at 1510 levels. The stock has been trading in bullish territory for the last many sessions. The volume is also rising gradually, which suggests buying interest among the trades. On the daily time frame, the stock has settled above Upper Bollinger Band formation with a positive crossover in MACD indicator. Based on the above technical structure, we are expecting bullish strength in the counter for the upcoming session.
ASIAN PAINTS
The stock increased more than 3 during the week and closed at 3,050 levels on the Friday trading session. The stock has been rising continuously for the last couple of weeks, which shows bullish strengths. However, in the recent week, the stock has formed a pattern like an Evening Star candlestick, which could be a reversal sign for the upcoming week. In addition, a momentum indicator RSI (14) is also trading in overbought territory, which shows some buying exhaustion among the trades. For the coming week, the stock may find the resistance around 3130 levels, whereas immediate support comes at 2900 levels.

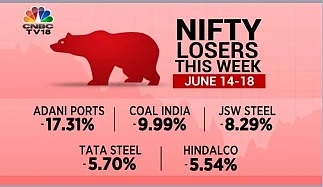
Top losers
ADANI PORTS
Adani Ports has been on a falling streak due to panic selling since the past few days. The stock closed at 694.35 on Friday gaining more than 7 percent. The stock has closed with a major buying volume along with a closure above the VWAP which indicates a good potential for upside. The Chaikin Money flow ended pointing upwards along with a positive crossover of stochastic from the over selling zone at the close, which indicates strong bullishness in the midterm.
COAL INDIA
Coal India has been falling from the heights of 164 and settling at 146.4 at the end of Friday (June 18) trading session. The stock has closed below the 15 days DEMA which indicates weakness in the near-term. The stochastic has fallen one way to the bottom indicating a major selling which is also confirmed by the volume indicator. Currently the stock has a support at 142 and a resistance of 157. The stock might test the support and give a bounce back on upside if closing below the support the stock is expected to further fall up to 137 level.
JSW STEEL
JSW Steel had been seen in a profitbooking stage for a decent number of trading sessions. The stock has settled at 670.6 at the end of the day. The stock has closed above the bullish Ichimoku Cloud, indicating a positive side for the stock in the near term. The stochastic is expected to have a crossover towards the upside within the next few trading sessions. Currently the stock has a support of 648 and a resistance of 736.
TATA STEEL
Tata Steel has closed at 1092.3 and has seen tremendous buying in the last half an hour of Friday's (June 18) session with volume over 15 million. This makes the stock settle above the VWAP during the last hour. The stochastic is expected to give a positive crossover in the upcoming sessions as the convergence line has given a good bounce from 18 levels to 30.79 levels. Overall, the stock had good volume gains , thus a demand in the stock has been created, and an upside move can be seen in the further trading sessions. The stock currently possesses a support of 1,040 and a resistance of 1,150.
HINDALCO
It has formed a hammer at the end of the day closing at 371.35 settling above VWAP with a volume above 5 million on the buy side, which defines a bullish trend. The volume indicator during the last half an hour of the trading session indicates a good demand for the stock for the near term. The Stochastic on other hand has given an upside crossover right from the over selling zone, indicating a good buy for the stock. The stock can be bought for a near-term target of 404.
(The writer is Executive Director, Choice Broking)


