GTF Indicator: A Smarter Way To Read Demand And Supply In The Stock Market
The GTF Indicator simplifies stock market trading by automatically identifying demand and supply zones, helping traders avoid chart clutter and make informed decisions. Its ecosystem includes the Automatic Demand and Supply Indicator, GTF Indicator 2.0, and My GTF Traders Community, offering trend analysis, multi-timeframe insights, and structured technical analysis for traders at every level.

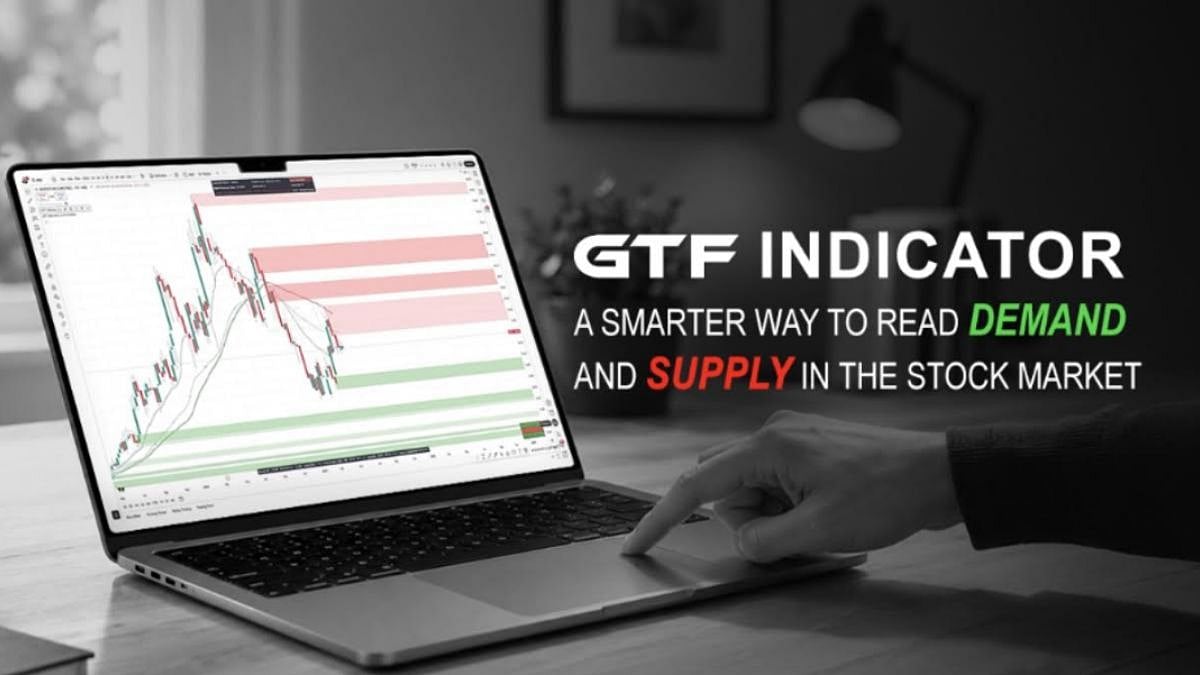
GTF Indicator: A Smarter Way To Read Demand And Supply In The Stock Market | File photo
Every trader has the same goal: finding the right trade at the right time. But just a few weeks into the stock market, traders realise that trading isn't about finding opportunities, it's about ignoring the distractions.
Today, there are many indicators on the charts. Some traders use oscillators, RSI, MACD, volume, moving averages, and other indicators together to make better decisions. But generally, the opposite happens. Each indicator says something different, the chart turns into a mess, and instead of feeling confident, traders become confused.
This is exactly what the GTF Indicator was designed to solve.
Rather than making trading complicated, the GTF Indicator focuses on one solid concept in technical analysis: demand and supply. It automatically identifies and highlights the zones where buyers and sellers have shown strong interest before, making you understand the market, so you can plan your next move accordingly.
The push and pull between buyers and sellers is what really drives the stock market. When buyers dominate, price moves upward, and when sellers become stronger, price starts falling. This buying and selling creates key price levels where the market has reacted before.
A lot of experienced traders depend on these zones to spot good entry and exit points. But manually marking these levels on every stock and timeframe is very time-consuming. The reason is that every trader has their own way to analyse the chart.
The GTF Indicator takes the guesswork out by automatically pinpointing these key zones through a rule-based approach. This allows traders to spend less time drawing charts and more time actually understanding how prices move.
The GTF Indicator isn't just an average technical indicator. It's a complete demand and supply trading ecosystem built to help traders decode the stock market with real structure.
As traders' needs evolve, this ecosystem also evolves with them. It includes three powerful solutions that are interconnected.
The Automatic Demand and Supply Indicator forms the base by automatically marking demand and supply zones. GTF Indicator 2.0 takes it to the next level by adding advanced trend and market insights. Those traders who want a broader view, GTF Traders Community brings in higher-timeframe analysis, plus extra market information for a more holistic experience.
Each version of the GTF Indicator is created to meet the different trading needs of traders. Let's understand what each version offers and how it helps traders analyse the market more effectively:
From here, every trader starts their trading journey. The GTF Automatic Demand and Supply Indicator is designed to automatically identify demand and supply zones without requiring traders to mark them manually.
Rather than wasting hours analysing charts, traders can instantly spot areas where buying or selling pressure is expected to appear. Since the zones follow fixed rules, results stay consistent across stocks and timeframes. This helps beginners understand market structure and saves the time of experienced traders.
The GTF Indicator 2.0 is an upgraded version of the Automatic Demand and Supply Indicator. Beyond just marking demand and supply zones, it also gives you higher-precision demand and supply zones, trend analysis, a smart dashboard, and multi-timeframe EMA analysis, all in one place.
With the GTF Indicator 2.0, you get Aggressive, Conservative, and Dynamic modes, so you can analyse the market that suits your trading style. This helps you understand market conditions faster and trade with confidence.
It is designed for traders who want to understand the stock market deeply. My GTF Traders Community displays weekly and monthly zones directly on lower-timeframe charts so traders can see the overall market trend without switching charts.
On top of that, it brings in the Invisible Candle, multi-timeframe candles, and fundamental data features. This adds more depth to chart analysis and helps traders make smart and more informed decisions.
You can access the GTF Indicator mainly in three ways:
1. Enroll yourself in the Trading in the Zone – Live (Technical Analysis) course, where you receive lifetime access to the indicator.
2. Opening a Dhan trading account using GTF's referral code, where access is provided based on your trading activity.
3. Buy the indicator (₹5000 + GST for one year).
All of these options let traders use the GTF Indicator while learning a structured approach.
You become successful in trading only by understanding the stock market, not by using more indicators. The GTF Indicator ecosystem makes chart analysis easier by automatically spotting demand and supply zones and delivering crucial market insights. Starting with a solid foundation from the Automatic Demand and Supply Indicator, moving into deeper analysis with GTF Indicator 2.0, and My GTF Traders Community, each version sharpens trading decisions. Together, they support traders in every stage of their trading journey.
Published on: Tuesday, July 28, 2026, 03:22 PM ISTRECENT STORIES
-
-
-
-
-