Why Most Retail Traders Get Pattern Reading Wrong And What It Is Actually Costing Them
Candlestick patterns alone cannot guarantee profitable trading, the article argues, citing academic research and SEBI data showing most retail traders lose money. It advocates systematic backtesting, disciplined risk management, accounting for trading costs and algorithmic approaches to build a sustainable trading edge.

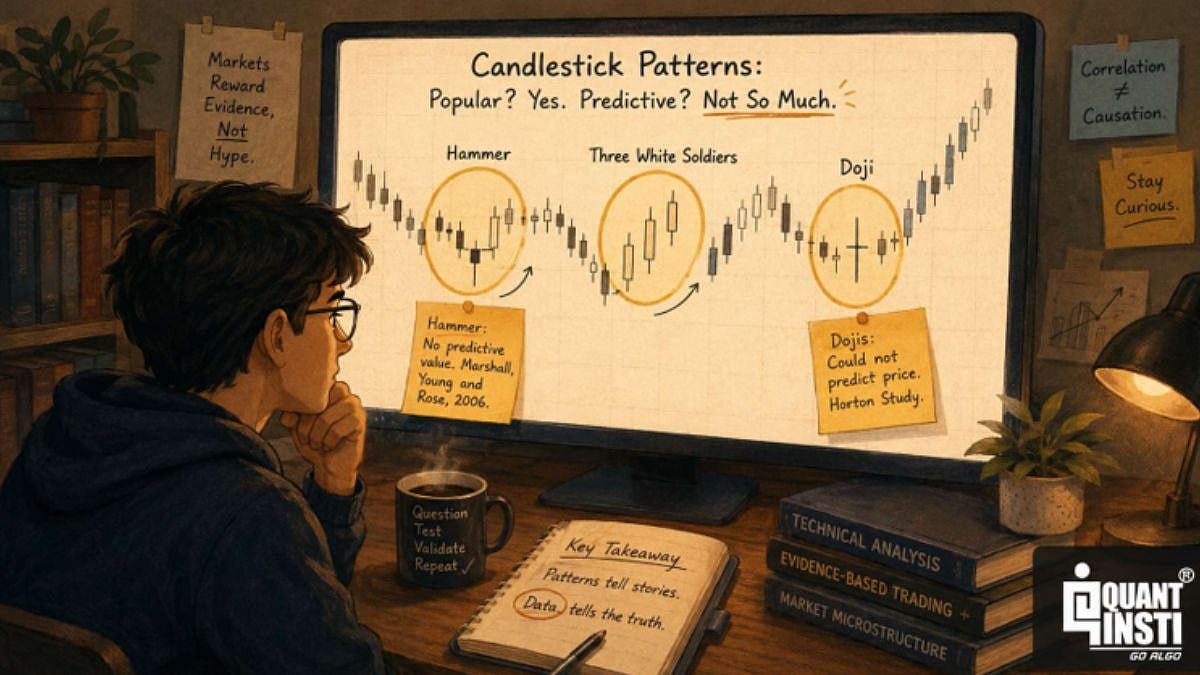
Ishan Shah explains why successful trading depends on systematic testing, risk management and disciplined execution rather than chart patterns alone | Representational Image
Learning candlestick patterns is one of the easiest ways to start trading. You see three green candles rise in a row, a formation old traders call Three White Soldiers, and you decide the next candle will be green too. It feels like reading a map. The shape sits there on the screen, the rule sits in your head, and the trade almost places itself.
I have watched a lot of people trust that map and lose money. Most of these patterns were passed down for one simple reason: someone, long ago, said they work. A Hammer here, a Doji there, three soldiers marching up. They come from the rice markets of 17th century Japan, and they have been repeated for three hundred years. But repeating something for three hundred years does not make it true. What most of these patterns still do not have is proof.
When researchers tested them properly, the proof did not show up. One of the studies in these was done by Marshall, Young and Rose in 2006 and published in the Journal of Banking and Finance. They tested the famous candlestick patterns on the Dow stocks across ten years of data. They also compared the patterns against random, made up price charts, to check whether the signals did any better than pure luck. Their answer was these patterns "do not have value" for those stocks. A separate study by Horton tested eight patterns on hundreds of US stocks and found that Stars, Crows and Dojis could not predict price at all.
The problem was never the candlestick. The problem is blind faith in the candlestick.
You can spot a perfect textbook pattern, enter the trade on the next candle, and still lose money for reasons that have nothing to do with the pattern. You entered without a stop loss. You had no target. You paid a wide spread while chasing the move. You used the same setup in a calm market and a wild market, and expected the same result. The pattern was only a starting point. Everything around it was missing.
A shape is not a signal
Reading patterns is far more personal than it looks. One trader sees a Bullish Marubozu where another sees only random noise. Show the same chart to ten traders and you will get many different answers about whether the pattern is even there. If a method depends on the eye of the viewer, it cannot be repeated. And a method you cannot repeat is not a strategy. It is just a mood.
Why do our eyes fool us so easily? Because the human brain loves to find patterns. This instinct kept our ancestors alive, but it works against us in front of a price chart. Scientists have a name for the habit of seeing meaning in random data. The writer Michael Shermer called it patternicity, the tendency to find a pattern in pure noise. There is a related habit too. We see a short winning streak in a small set of random results and feel sure it means something, the same way a long run of red on a roulette wheel starts to feel important. A chart of pure random numbers will still show you Hammers and Head and Shoulders if you stare long enough. Seeing a shape does not prove the shape means anything.
It gets worse when you remember how little a chart actually shows. Every candle is built from just four numbers: the open, the high, the low and the close. The wicks tell you where the price tried to go and got pushed back. They are the record of the fight between buyers and sellers inside that candle. Look only at the shape, and you miss the real story hiding in those numbers.
And this is not only about candlesticks. The same trap sits inside every classic pattern. Head and Shoulders, Double Top, bull flag, ascending triangle. Each one is a neat story drawn over messy data. Each one tempts you to believe the future must follow the picture. The market never made that promise.
Treat the pattern as a question, not a prophecy
This one shift changed how I think about trading. Stop treating a pattern as a prophecy. Start treating it as a question you are allowed to get wrong.
Once you do this, better questions appear. How does this pattern really perform across hundreds of trades, not the two or three you happen to remember? Does it work in a rising market and a flat one? Did it work in 2008 and again in 2021? Finding one setup that worked once, and then assuming it will work forever, has a name. It is called data snooping, and it has emptied more accounts than any single bad trade.
This is not just a warning. In a well known 1999 study, three researchers named Sullivan, Timmermann and White tested a large set of trading rules on a hundred years of market data. The single best rule looked like the work of a genius in that history. But when they ran the same winning rule on the next ten years of fresh data, the edge vanished. The lesson is simple. Test enough rules on enough history, and one of them will always look brilliant by luck alone. That is not a discovery. It is a trap in disguise.
So here is the better path. First, write the pattern as a clear rule, exact enough to turn into code. This step alone removes most of the guesswork. Next, test it on past data across both good years and bad ones, with a sample large enough to separate a real edge from luck. Watch out for two silent mistakes. One is lookahead bias, where you use information you would not have had at the time. The other is survivorship bias, where the losing stocks have quietly been removed from your data. And even a great looking result still has to survive a fresh test, on data it has never seen before. That is the difference between a real edge and a strategy that has only memorised the past.
A pattern can become a real edge. It just has to earn the title.
Here is something that did not exist a few years ago. You no longer need to be a programmer to start. You can open Claude, choose a market, and describe your idea in plain English. You can simply say, "Find the Hammer pattern on the Nifty 50. Here is my entry, stop loss and target rules. Tell me how it would have performed." In a few minutes, you learn whether the idea has any merit, without trading it live and paying the market a fee to find out. That is the real value of AI here. It closes the gap between having an idea and knowing whether the idea is worth anything.
The costs nobody draws on the chart
Even a tested edge can slowly bleed away. The cost of a trade is not only the stop loss when it gets hit. There is also the gap between the price you decided to act on and the price you actually got. Retail traders fire market orders to chase a pattern, pay the full spread, and take slippage on top.
On a single trade, none of this hurts much. You barely notice it. But over dozens of trades, then hundreds, then thousands, these small costs add up. They quietly decide whether your strategy makes money or loses it. The Indian numbers make this very real. SEBI studied the derivatives market and found that the average individual trader spent close to 26,000 rupees in a single year just on trading costs, the brokerage, the exchange fees and the taxes. That money goes out before the market has even decided whether you were right. So if your edge is smaller than your costs, you do not have an edge. You have an expensive hobby. This is exactly why professionals obsess over execution and use methods like VWAP and TWAP to break a large order into smaller pieces and reduce its impact. The amateur never measures these costs, so the amateur never sees them arrive.
Emotion is the other hidden cost. Without rules set in advance, fear and greed take the wheel. You hold a loser, hoping it comes back. You dump a winner the moment it wobbles. A systematic approach hands these decisions to a fixed plan, which frees your mind for the real work, which is research, instead of sweating every tick.
The edge is the system, not the shape
It helps to picture a real strategy as layers, not as one clever idea. Prodipta Ghosh, a Vice President at QuantInsti, describes five of them. The input layer, where market, fundamental and alternative data arrive. The processing layer, where raw data becomes clean, usable features. The intelligence layer, where the signal is created. The order management layer, where signals become position sizes and risk limits. And the execution layer, where trades are placed with low market impact. Most retail traders live only in that third layer, the signal, and even there their logic is loose. Take away the clean data, the risk control and the careful execution, and a good idea has nowhere to stand.
So who actually wins by building all five layers? SEBI has already counted. In a year when individual traders were losing heavily, the foreign desks and the professional trading desks earned most of the profits in the derivatives market. And almost all of those profits, around nineteen out of every twenty rupees, came from algorithmic trading. Read that again. The money does not flow to the people with the nicest looking chart. It flows to the people who turned their ideas into tested, cost aware, automated systems. The signal was never the prize. The system around it was.
You do not need to build all five layers tomorrow. But you do need to stop believing that the signal is the whole game.
So what should change in practice? Write your pattern as a rule clear enough to test. Backtest it across different market conditions, on a large sample. Add transaction costs before you celebrate any result. Set your stop loss and your target before you enter, never after. Size each position by the loss you can afford, not the profit you are dreaming about. And keep a trading log, because a strategy you cannot measure is a strategy you cannot improve.
What it is really costing Indian traders
Let me put a number on the losses I mentioned at the start, because in India this is no longer a matter of opinion. SEBI now studies this market every year, and the picture barely moves. In its most recent study, about 91 percent of individual traders in the equity derivatives market lost money. Their combined net losses crossed 1,05,000 crore rupees in a single year. The average loss maker was down a little over one lakh rupees. In an earlier three year window, the loss rate was 93 percent and the total losses crossed 1.8 lakh crore rupees. These are not a handful of unlucky people. This is the normal outcome. And here is the saddest detail of all. More than three out of every four traders who lost money kept right on trading.
Why do people refuse to stop? Nassim Taleb spent years watching traders confuse luck with skill, and in his book Fooled by Randomness he made a sharp point: lucky fools never suspect that they may be lucky fools. A trader can ride a pattern through a kind market for months. He thanks the pattern, not the calm conditions, and never imagines that the next market owes him nothing. Andrew Lo, an economist at MIT, says something similar in gentler words. A market edge is not a fixed law like gravity. It is closer to a living thing. It can work for a while and then fade as conditions change. A pattern that worked beautifully last year can quietly stop working, and the chart will not send you a warning first.
So remember what this game is really about. You do not survive by being right every time. Nobody is. You survive by staying in the game long enough for your edge to play out, and that means protecting your capital above everything else. Risk control, no overtrading, and the discipline to stay inside your own system are what keep you at the table. A trader who is right 60 percent of the time and respects these rules will quietly outlast a trader who is right 80 percent of the time and blows up on the one trade where he ignored them.
Testing with an AI assistant is the start, not the finish. When you are ready to go further, learning Python will supercharge your whole process. It has become the common language of quant finance because it is open source, rich in ready made libraries, and lets the same code travel from research straight to live trading. With it, you can pull data, build features, run thousands of backtests, size positions and automate execution, all in one place. If you want a structured path instead of years of trial and error, an algo trading course like EPAT or a self paced Quantra course can shorten the journey. But the mindset matters more than any single course.
None of this means the candlestick is worthless. It means the candlestick is only a beginning. Your edge does not come from seeing a shape that everyone else can also see. It comes from the quality of your testing, the honesty of your costs, and the discipline to act on evidence instead of feeling. Patterns are simply observations of human behaviour. Measure them, manage the risk around them, and you stop trading on faith. You start trading on probability. That is the whole difference, and it is the only difference that compounds in your favour over time.
About the Author
Ishan Shah Lead, Research and Content, Quantra
Ishan Shah serves as the Lead of Research and Content at Quantra by QuantInsti and is a faculty member for the Executive Programme in Algorithmic Trading (EPAT), where he focuses on quantitative strategy development, systematic trading, and statistical arbitrage. His professional background includes roles within the Global Markets team at Barclays and at Bank of America Merrill Lynch, and he is a co-author of the publication "Machine Learning for Trading".
An experienced speaker, Ishan has conducted workshops and sessions for various organizations, including the Singapore Exchange (SGX), Zerodha Varsity, PyData Mumbai, IBKR Campus, and the Face2Face Conclave. He is recognized for his ability to distill dense trading concepts into accessible learning paths, assisting practitioners in using data, statistics, and rigorous research to construct and refine algorithmic trading strategies.x
Published on: Thursday, June 25, 2026, 10:33 PM ISTRECENT STORIES
-
-
-
-
-